Tuvalu remains home, while Tuvaluan communities in Aotearoa sustain family, language and identity across the Pacific. This demographic connection is important context, but the census data do not identify climate change as the reason individuals moved.
Data & methodology
This project presents illustrative elevation-threshold exposure under selected relative sea-level increments. It is not an engineering flood model, a hydrodynamic inundation model, or a prediction of future shoreline change.
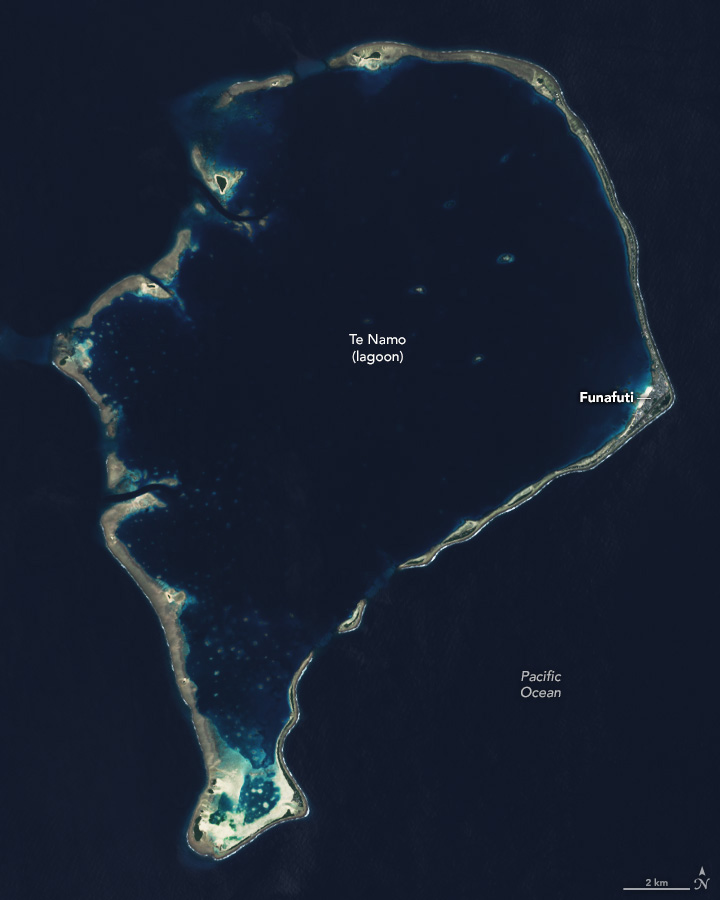
Scope: spatial exposure modelling is limited to Funafuti. Tuvalu's 2022–23 Census recorded 6,602 residents in Funafuti by region of enumeration, 62.1% of the national resident population. The other eight islands and atolls are not modelled individually.
Scenario interpretation: +0.5 m, +1.0 m, +1.5 m and +2.0 m are illustrative elevation thresholds, not year-specific forecasts. The observed 1993–2023 SPC sea-level anomaly series is a separate evidence stream and is not mathematically converted into these thresholds.
Model baseline: the 3.502 km² baseline is the summed area of valid ASTER DEM pixels above 0 m within the Funafuti study-area clip; it is not Funafuti's official land area. Approximately 5,905 modelled people overlap those DEM-positive pixels. The native 2020 WorldPop Funafuti clip totals approximately 6,320 modelled people.
Population processing: WorldPop was reprojected to the ASTER grid using nearest-neighbour resampling. NoData values were excluded, and the aligned population values were rescaled so that their total matched the native clipped WorldPop total before exposure was calculated.
Limitations: the simplified threshold method does not model tides, waves or wave run-up, storm surge, groundwater flooding, erosion, drainage, coastal defences, hydrodynamic connectivity or future shoreline geomorphology. ASTER GDEM has substantial vertical uncertainty over a very low, narrow coral-atoll environment. ASTER elevations are stored in whole metres, so identical adjacent threshold results can reflect DEM quantisation; the 0.5 m slider increments do not imply 0.5 m DEM precision. Results should therefore be interpreted as screening-level elevation exposure rather than precise flood extents. The LiDAR elevation statistics shown in the introduction are used only as an external topographic reference; the threshold analysis itself uses ASTER GDEM.
Population context: WorldPop 2020 is a modelled population estimate, not a census headcount. Its native 2020 Funafuti clip totals approximately 6,320 modelled people, close to Funafuti's 2017 resident population count of 6,320. This agreement is used as a reasonableness check only and does not imply that the datasets are equivalent.
Sources: Pacific Data Hub / SPC Sea Level Anomalies (SPC:DF_CLIMATE_CHANGE, 1993–2023); NASA/METI/AIST/Japan Spacesystems and the U.S./Japan ASTER Science Team, ASTER GDEM V3 (DOI: 10.5067/ASTER/ASTGTM.003); WorldPop 2020 Population Counts, R2025A v1 (DOI: 10.5258/SOTON/WP00839; modelled alpha product); Tuvalu Central Statistics Division, 2017 Mini-Census and 2022–23 Population and Housing Census; Wandres et al. (2024), LiDAR topography, DOI: 10.1029/2023EF003924; Stats NZ, 2023 Census Tuvaluan ethnic-group summary; Immigration New Zealand, 2026 Pacific Access Category; and OpenStreetMap contributors for the Funafuti study-area boundary and basemap context. Full citations and licence notes are available in the project repository.
Acknowledgements: Pacific Community (SPC), Pacific Data Hub, Tuvalu Central Statistics Division, NASA/METI/AIST/Japan Spacesystems and the U.S./Japan ASTER Science Team, WorldPop, Stats NZ, Immigration New Zealand, and OpenStreetMap contributors.